INTERACTIVE DEMONSTRATION
A farm dashboard you can explore.
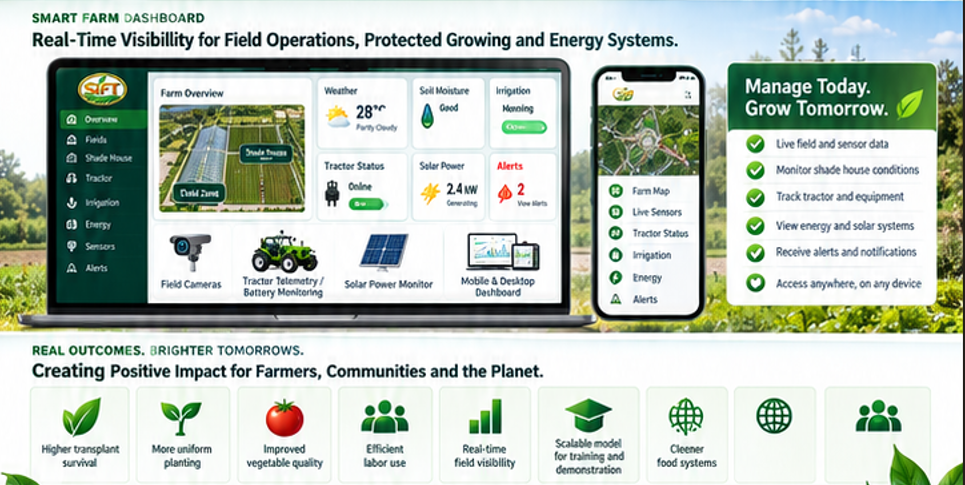
Change the sample crop zone and export the demonstration dataset. This interface illustrates the planned experience; it does not show live farm conditions.
SAMPLE DATA ONLY
See the information in context.
Farm overview
Seven-day moisture example
What this view will support
01 Identify crop-zone trends
02 Review irrigation records
03 Plan tractor work and charging
No sensors are connected. These examples are not irrigation recommendations.
FROM EXAMPLE TO OPERATIONS
Live data requires a separate integration.
CONNECT
Integrate approved devices
Choose the data platform, gateway, network server, device identifiers, and signed server-side interfaces.
CHECK
Keep data trustworthy
Record units, calibration, timestamps, missing readings, and quality flags. Define crop-specific interpretation.
PROTECT
Limit access and scope
Keep credentials out of browser code. Give operators a secure, private environment; publish only approved read-only summaries.
There are no hidden connections, active sensors, remote irrigation commands, tractor commands, or subscription services in this demonstration.
START A CONVERSATION
Plan the next step from demonstration to connected operations.
Explore demonstration opportunities, training, technology integration, or a farm model for your community.